
Google Analytics is one of the many tools that Google makes available to help website owners understand what visitors are doing on their website. With this tool you can track and analyze important data about your website and your website visitors. It’s one of the most popular free tools out there.
The amount of data that Google Analytics makes available makes it an essential part of any website manager or marketer’s online toolbox. In this guide to Google Analytics, we’re going to cover some of the most important things you need to know about the tool.
What is google analytics
Google Analytics is the leading analysis platform for measuring the performance of websites or applications. It is part of a series of tools provided by Google. Including the Google Search Console and the Google Tag Manager.
The platform gives you a complete picture of your website’s performance. It collects a large amount of data and intelligently processes it. It then generates reports to show you this data. You can then use these reports to gain critical insight into your website and your visitors.
Data acquisition
The first element of Google Analytics is data collection. The platform can collect a wide range of data about your website and how visitors use it. The exact nature of the data collected is discussed in detail later.
Above all, this includes:
- How many visitors your pages get
- Where the visitors come from
- How these visitors navigate
- What the visitors do
- Like the visitors with the elements
- How much time visitors spend on your pages
- At what point do visitors leave your site
Google Analytics uses simple JavaScript code to collect all of this data. You will get this code when you set up analytics for your website, as explained later. The code is added to each page and sets a cookie in each website visitor’s browser. The cookie then sends a hit to your Google Analytics account, which reports every interaction the user has with your website.
Google Analytics works with three different types of hits:
- Pageview Hit – A hit that is sent every time someone visits one of your pages. It contains information such as which device and which browser the visitors are using. You can also find out which of your pages they visit.
- Event Hit – A hit sent when a visitor does something on your website. For example, they can fill out a form, click a link, or play a video.
- Transactional / Ecommerce Hit – A hit sent when a website visitor makes a purchase. These hits can contain information such as which pages the visitor visited before purchasing. It also shows less complex results, such as what products they bought or how much money they spent.
Data processing
Google Analytics does not present you with the raw data that the platform collects, it processes data first and then creates reports. The first stage of data processing is the separation of the data according to users and sessions.
- User data – This is data about various different visitors to your website. Google Analytics creates a unique, random user ID for every new visitor to your website. If the same user visits your website again in the future, Analytics will recognize the user ID. These are then logged as “returning” visitors; however, this only works if they are using the same device. The process can also be bypassed by deleting your cookie from your browser cache.
- Session Dates – A session determines the amount of time a user spends on your website. It starts with a page view when the user visits the website for the first time and continues until they finally leave the website. During each session, Analytics collects a number of different types of session data.
This session data includes the pages visited, the actions taken and the time spent on your website. You can use this data to gain insights into user behavior on the site. They can be vital to understanding website performance, as we’ll discuss below.
Reporting
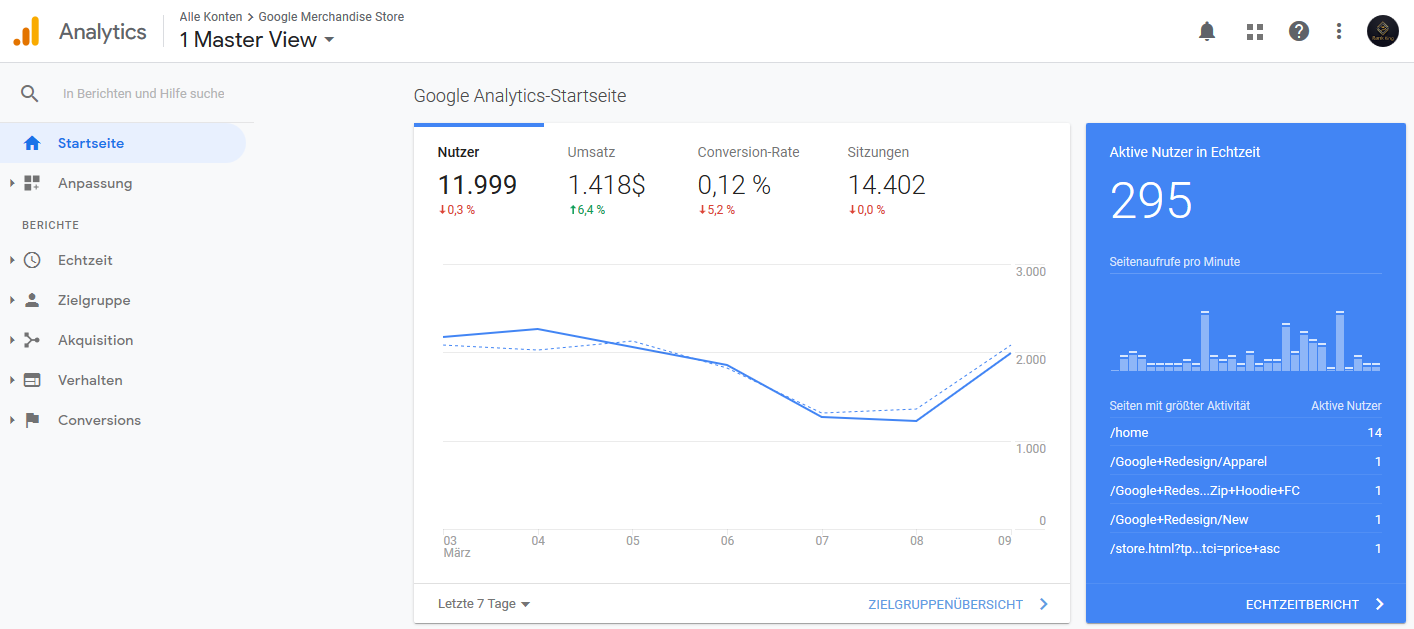
The Google Analytics processes are presented to you in the form of reports. These are visual representations of the data. They are designed in such a way that it is easy to identify patterns and gain knowledge from them. Finally, visual representations are known to be more effective at conveying complex ideas.
For example, the following is a report on the number of users on a website over a period of time:
All reports in Google Analytics show a combination of dimensions and metrics. It is important to know what each of these dimensions is in order to understand what the various reports are telling you.
- Dimensions – these are fundamental characteristics of the data collected. For example, “country” is a dimension that can be provided for user data. It provides information about the countries from which the website users come.
- Metrics – These are quantitative measurements; they indicate the number of something. For example, the “Sessions” metric tells you how many sessions have taken place on your website in a given period of time. Google Analytics produces a number of standard reports. We’ll take a closer look at many of them later. You can also create custom reports that combine different dimensions and metrics.
Not all dimensions and metrics can be combined in reports. They each have something called a “scope” – that is the level at which their data is collected. The different areas are “user level”, “session level” and “hit level”. Only the dimensions and metrics of the same scope can be combined.
Why you should use Google Analytics
You can use Google Analytics for a number of different purposes. The following section briefly introduces three of the most common uses of Google Analytics.
Marketing analysis
The insights you can glean from the analytics reports can be critical to improving your marketing.
The data collected can help you answer a number of questions about your marketing activities:
- How many visitors are directed to your website through the various marketing channels?
- Which websites deliver the most visitors?
- Where do the visitors to your website live?
- What is the conversion rate of visitors from different channels?
The answers to these questions will help you tailor your marketing activities to better suit your needs. They can show you the channels you should invest in and the ones you should stay away from. They can also help you better identify your target audience and provide many other helpful insights.
Analytics to improve website performance
Analytics reports are also a perfect place to find out more about your website and the people who use it.
In this area, the questions that the platform helps you to answer are even more diverse:
- Which of my pages are most visited?
- At what point do visitors leave the website?
- How fast do the pages on my website load?
- Do visitors using mobile devices have longer loading times?
These types of insights give you concrete ways to improve the performance of your website. Instead of a vague goal of “improving traffic”, you can have a more specific goal.
For example, you might find that your blog posts are getting a lot of traffic – that could tell you that creating more and promoting them well could help drive traffic even further.
Analytics to promote SEO
The insights from Google Analytics are also invaluable to support your SEO efforts.
The platform helps answer a number of questions about how users find and interact with your website:
- How many searches does your website get?
- Which of your landing pages is getting the most traffic?
- What searches do visitors use to find your website?
- What is your website’s response rate for visitors from different sources?
In SEO, as in many other areas, information is power. The more you know about your website visitors and your target audience, the better. Google Analytics is a platform that provides a wealth of data. If you access and use the right reports, they can help increase the ROI of your SEO efforts.
How to set up Google Analytics
Getting started with analytics is easy and straightforward. You need to create a Google account first . If you’re already using Gmail, Google Drive, or other tools, you already have one. Register with them and you can start setting up Google Analytics.
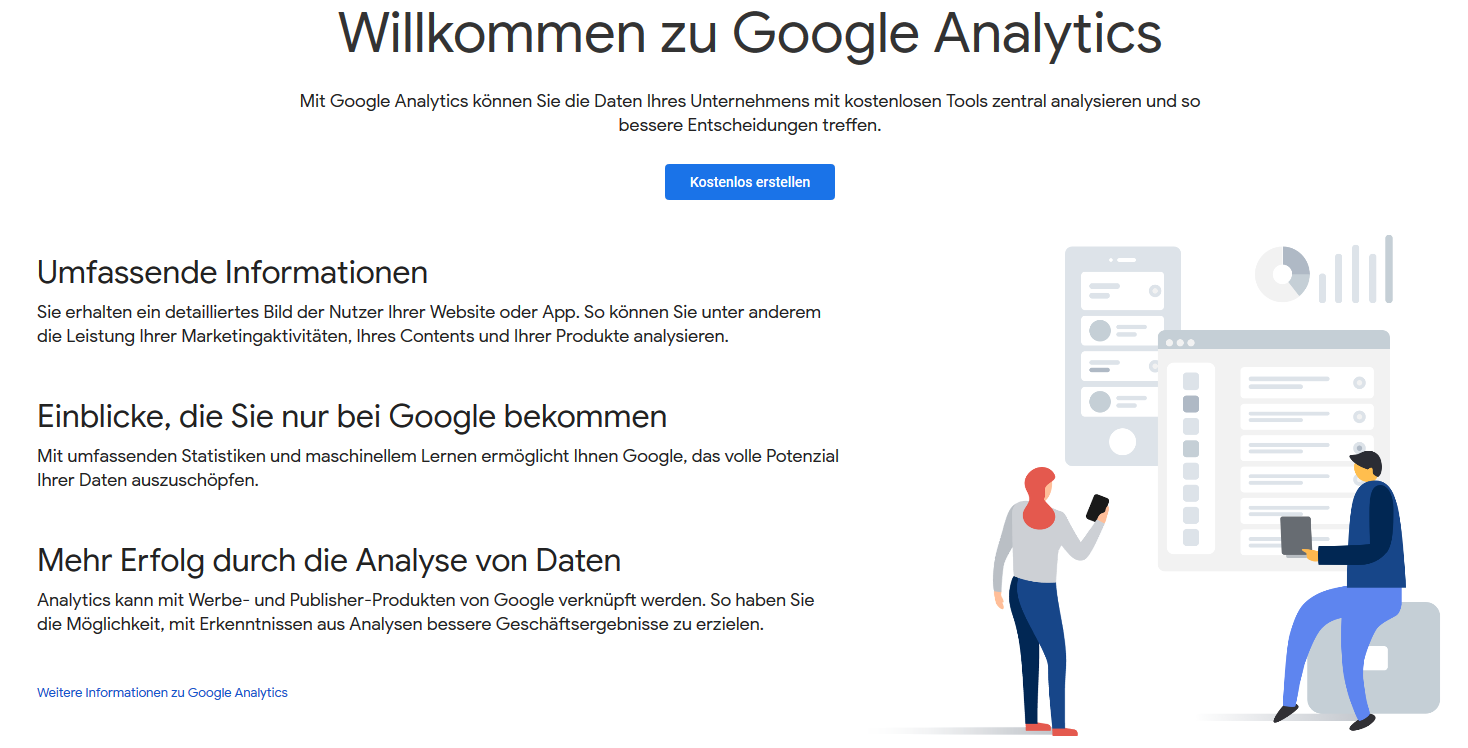
The graphic above comes from the Google Analytics homepage. When you are ready, click on the picture and you will get there. Then you can click on the button to register. You will then be redirected to a page where you should provide information about yourself and the purpose of Analytics that you intend to use:
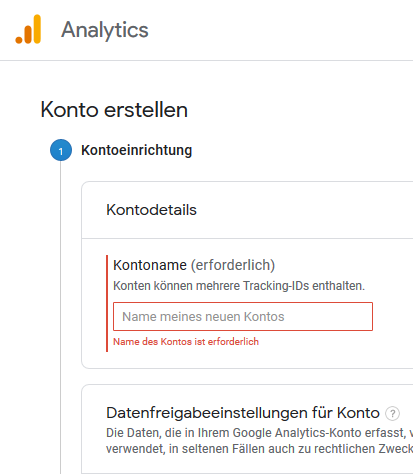
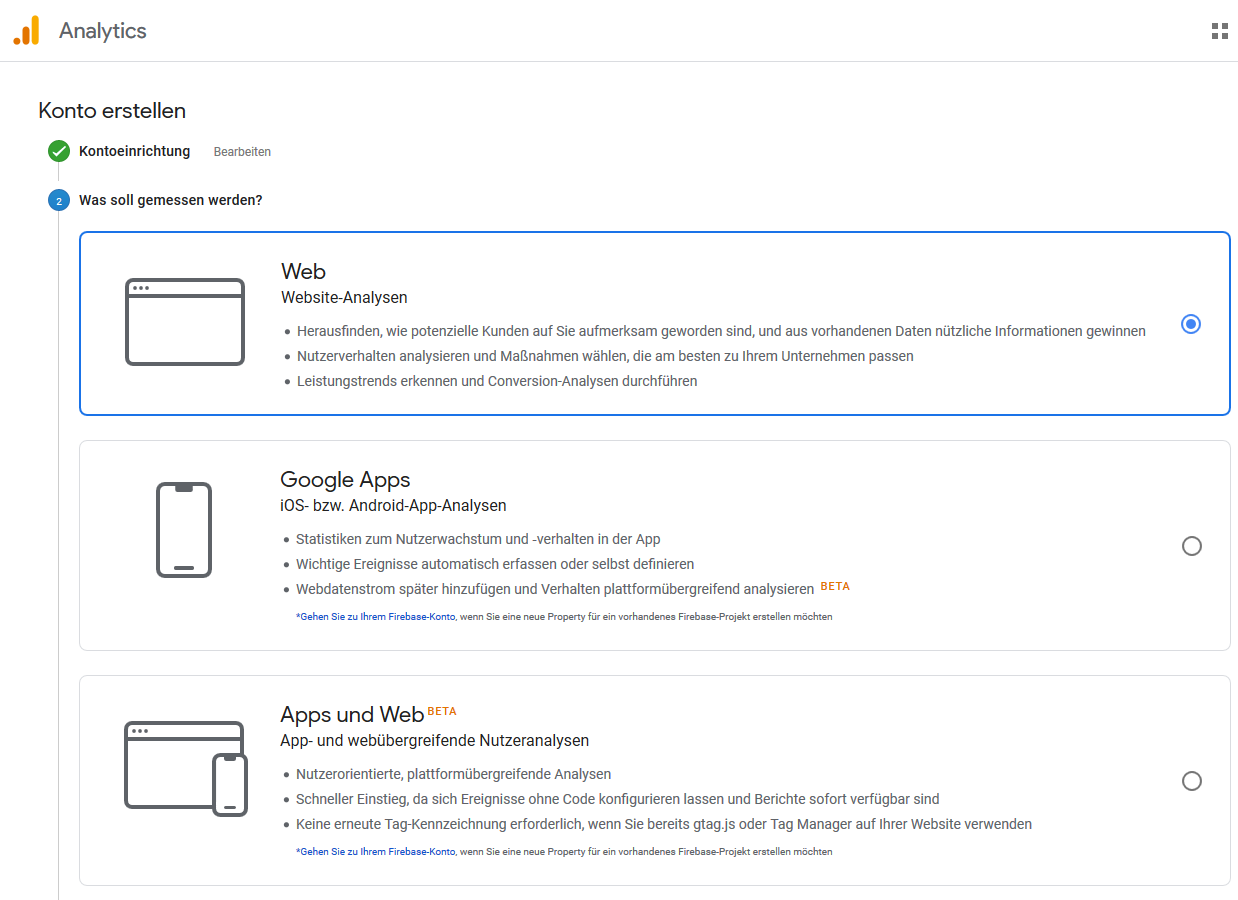
This part of the whole process is as simple as following on-screen instructions. After you have chosen an account name and made some settings, you choose what exactly should be measured.
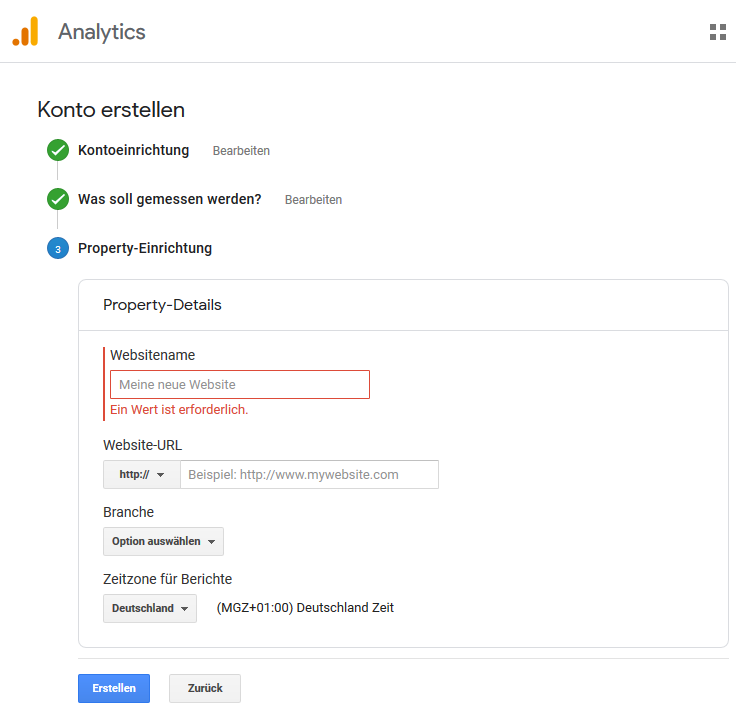
The final step in setting up the account is entering the exact details of the website you want to track. Once you’ve created your Analytics account, you can add up to 50 different websites to watch. For now, however, enter the URL that you want to link to your account.
When you click the “Create” button, your Analytics account will be set up and operational. You will also receive your tracking code for the selected website. This tracking code enables Google Analytics to collect data from your website visitors. Your next task is to add the code to your website.
How to add your tracking code
You’ll need to add your tracking code to every page on your website. Or at least every other type of page your website has. By adding the code in the header or footer, the code can be added to your entire website.
The tracking code must be added to your header file immediately after the <head> tag. If you built your website with HTML files, that means you need to add the tag to those files.
If you use a CMS like WordPress, you also have the option of installing Google Analytics via a plugin. If you search for “Google Analytics” on the WordPress plugins page, you will find a number of options (read reviews first before you decide). Then all you need to do is follow the instructions for installing the plugin.
If you use the Google Tag Manager , you don’t need to add a plugin or the code manually. In that case, you can easily add Analytics as a new tag via your Tag Manager account.
Once you’ve set up your Google Analytics account and added the tracking code, you’re ready to go. Analytics will start tracking data right away. While you’re waiting for the website’s data to build up, there are a few other analytics features that are well worth setting up.
How to set up a site search
One of the many valuable but straightforward functions of Analytics is site search tracking. With this function you can collect and analyze data on how visitors use the search function of your website (if available).
Once set up, this feature can give you a lot of useful information, including:
- What criteria website users are looking for
- How often the search is carried out
- Which pages do the searches most often
- How many times does a visitor leave your website right after doing a search
- Which pages the visitors start a search from most often
Setting up Site Search is easy and should take no more than a few minutes. As a starting point, do a search on your website. You should make a note of the URL that is generated. Then go to your Google Analytics account.
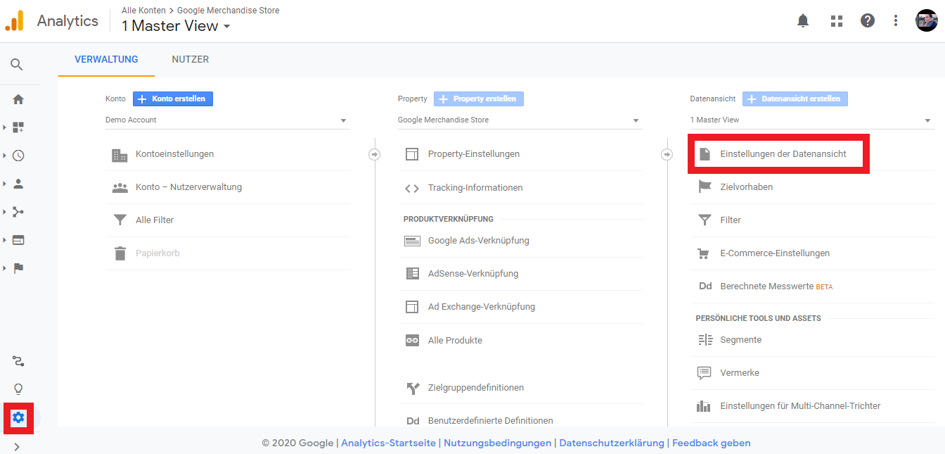
Open the administration menu by clicking on the gear icon in the lower left corner. Then select the alternative “Data view settings” in the “Data view” column on the right side of the page; this will open a new menu.
Scroll down until you find a section titled “Site Search Settings”.
![]()
Set the “Site Search Tracking” to “On”. Next you have to fill in the field “search parameters”. The previously generated search URL is entered there. For example, you may have entered “Google Analytics” in your site search. If you did that, the resulting url could look like this:
www.examplepage.de/search_results? s = googleanalytics
There is an “s” in the “search parameters”. This indicates the part of the URL that displays the search query. If that were the URL you generated, you would type “s” into the “Search parameters” field. Then all you have to do is click “Done” and the analytics site’s search function is set up.
How to set goals or conversions
Most websites exist with a purpose in mind. For example, getting someone to buy a product. Whatever your website’s goals, Google Analytics Goals provides a way to gauge how well it’s meeting those goals. That’s another reason why you should definitely set up analytics.
![]()
Your first stop is once again the analytics management panel. From there, select the “Goals” option as shown above. This will open a new page on which you select the button + “New Destination”. You can then decide whether to use an existing target template or create a custom target.
Destination templates will meet the needs of most website owners. They are designed so that you can capture all of the common goals of the pages. If you want to create a custom goal, it’s pretty easy.
First, state the goal. This name will appear on all reports that contain data about the target, so choose something obvious and memorable. Then you need to choose one of the four different types of goals that Analytics offers:
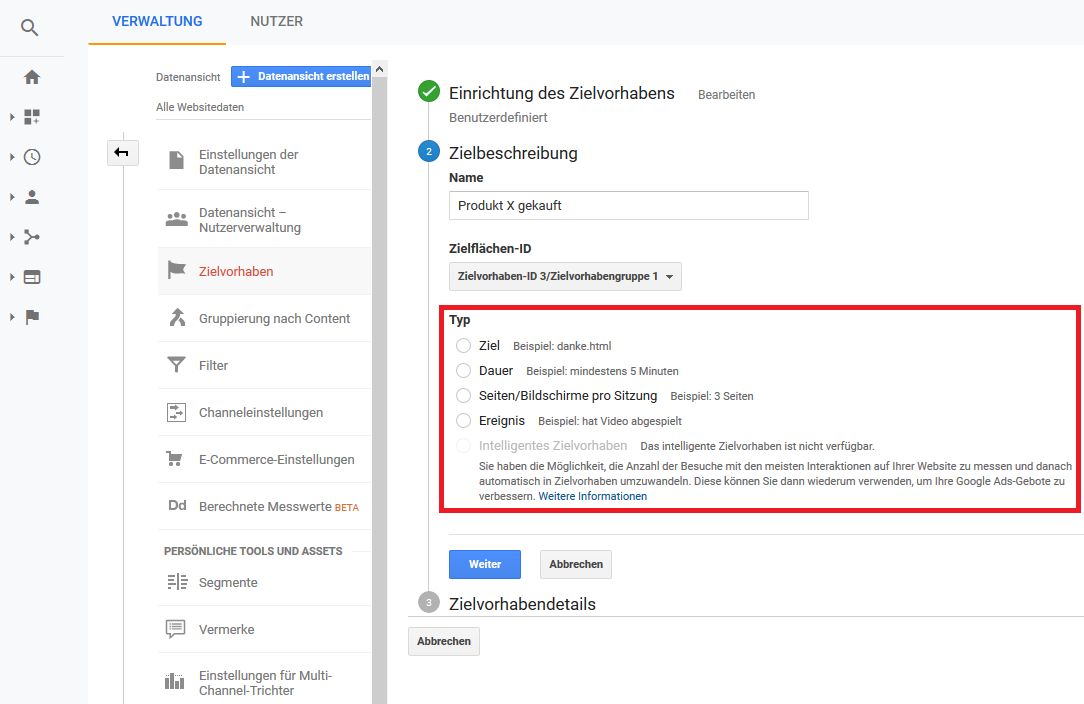
Each Analytics goal records a conversion when a website user takes a certain action. Which action that is depends on the type of target you have chosen.
- Goal – When a user visits a defined URL, a conversion is recorded.
- Duration – When a user spends a certain amount of time on the page, a conversion is recorded.
- Pages / Screens Per Session – When a user views a preset number of pages in a session, a conversion is recorded.
- Event – When a user takes a specific action. For example, clicking a link or playing a video.
After you’ve chosen the type of destination, there are a few more steps to follow. Google Analytics offers on-screen instructions. In general, you’ll need to fill in the specific details of the goal you want to pursue.
For example, you have to enter the URL for a specific destination to which access triggers a conversion:
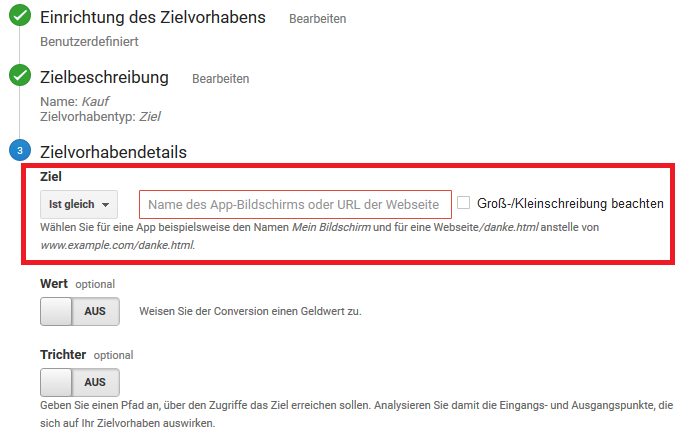
Duration and pages-per-session goals are easy to set up. There are only a few fields that need to be filled in with information about the exact nature of the goals.
The event goals are a little different. To set it up, you must first set up “Events” through Analytics. Google has a full guide on how to do this .
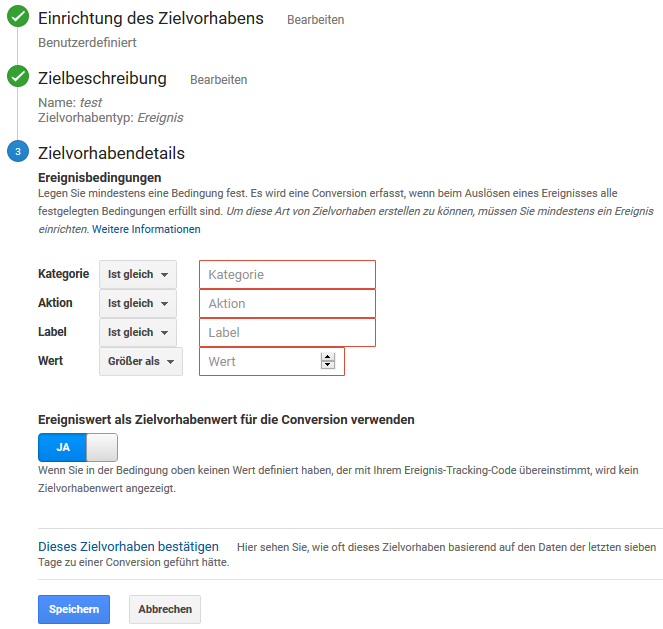
Once again, with setting up events, things are easy. Select the event you want a goal to relate to, then fill in the other simple fields shown above. Whatever type of goal you’ve set up, a click of the “Save” button will complete the process. Analytics then collects the data related to the target.
How to add additional accounts and properties
One last thing you may want to know before delving into the Analytics reports is how to add a new account or property. To do this, go to the main menu of the Google Analytics administrator.
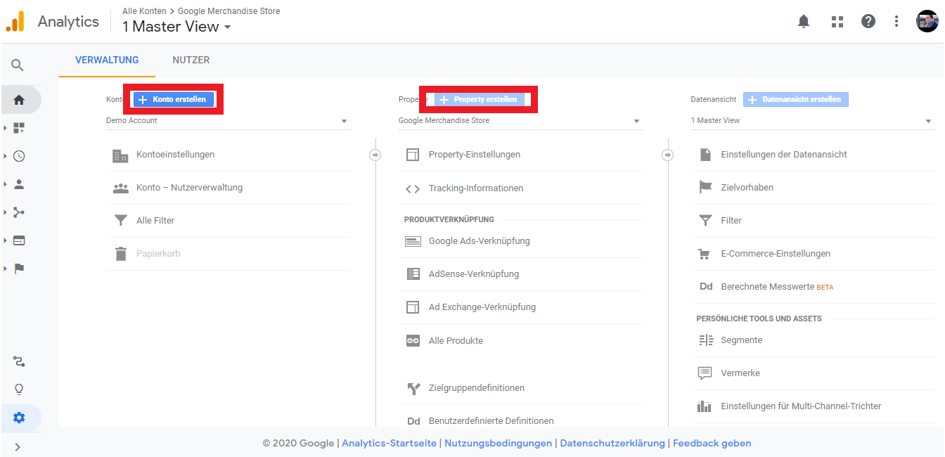
Two of the three blue buttons displayed there are “Create Account” and “Create Property”. Choose what is relevant to you. You will then be guided step-by-step through the process of setting up a new account or property.
Google Analytics dashboards
Once you’ve set up Analytics and its features, sit back and relax. After 24 hours, the platform should have collected enough data for you to call up your first reports.
You can access these reports from the Google Analytics dashboard. The home page of this dashboard is shown above and is also known as the overview dashboard. This is where all of your analytics access begins. On this page you will find everything you need to navigate the platform.
Overview dashboard
You can find links to specific analytics reports in the bottom left of the dashboard. We will go into each of the main types of reports in detail later. On the right-hand side of the overview dashboard you will find initial insights into your website’s data.
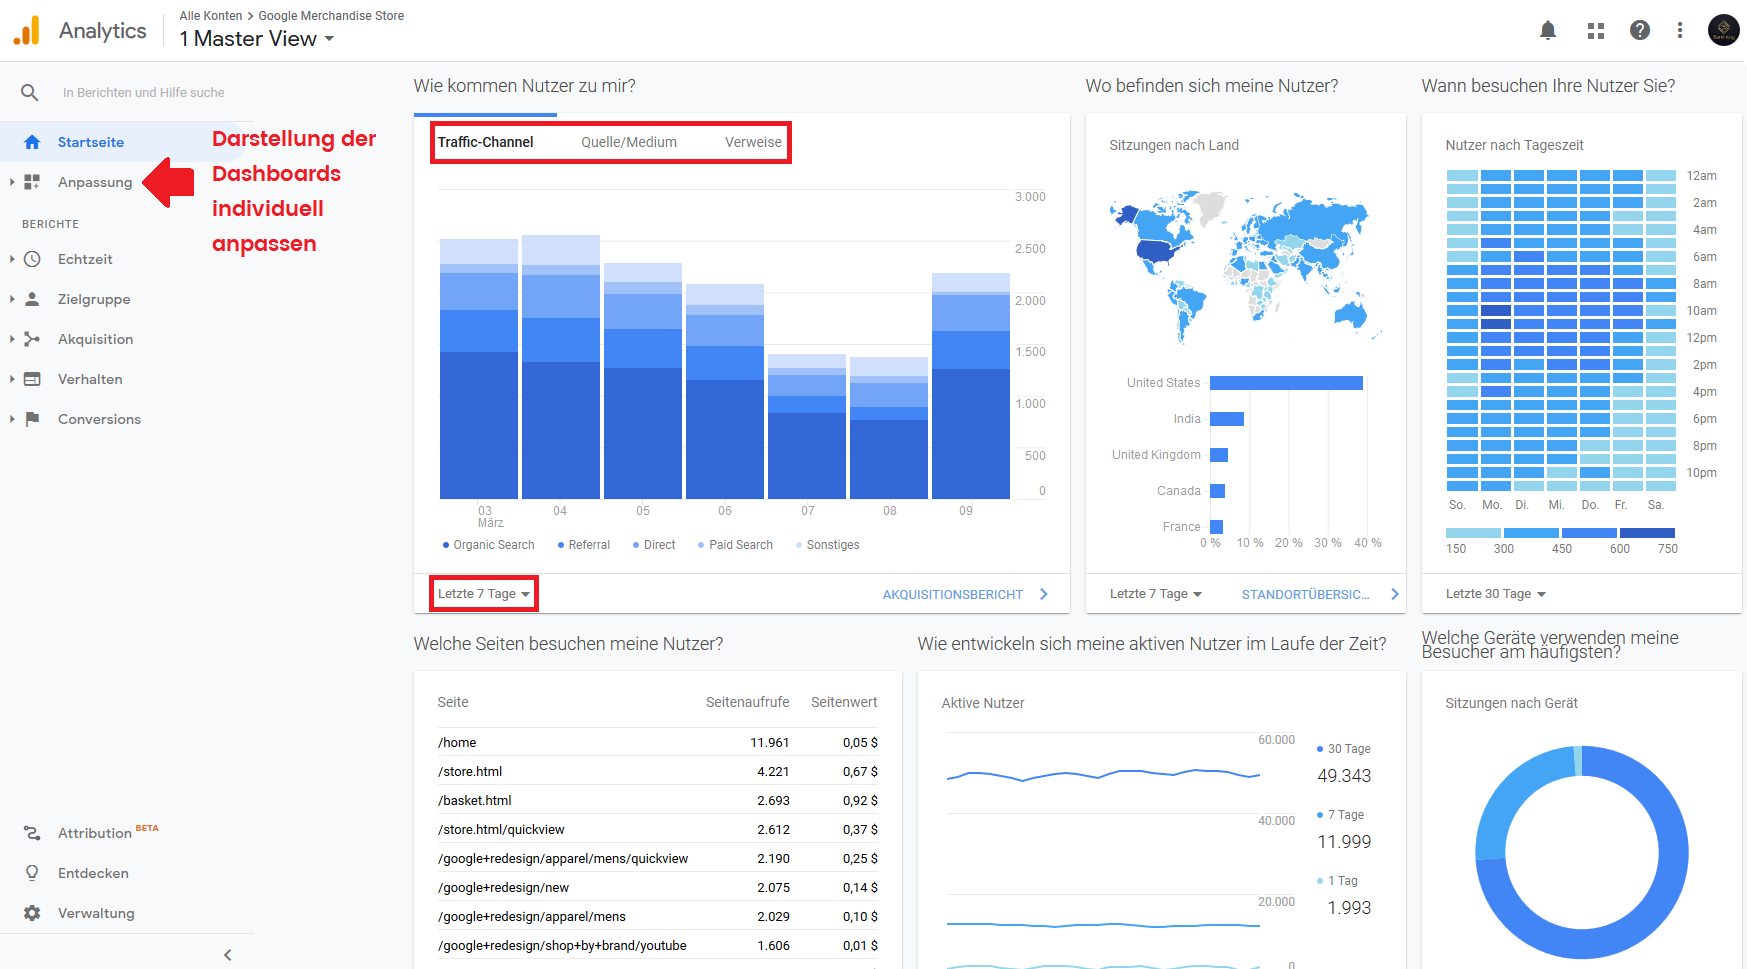
Charts, tables and other representations of your data are displayed on “Maps”. They are the panels on the right part of the homepage. There are simple choices attached to the cards to customize what they display. Usually, you can change the type of data shown and the time period for which it is shown.
Often times, you can also click a link to go to the full report that the snapshot was taken from. The layout of these reports is the same as that of the home page. You have cards with tables and graphs that you can edit to display various information as you wish.
There are five main categories of a report. Each category has a dashboard. You can access them by clicking the appropriate link in the bottom left of the Analytics menu. Each of these categories gives you a number of different reports.
Real-time dashboard
The real-time dashboard is the first option on the left menu. It looks similar to the home dashboard. The difference is that it only shows real-time data visualizations from users who are currently exploring your website.
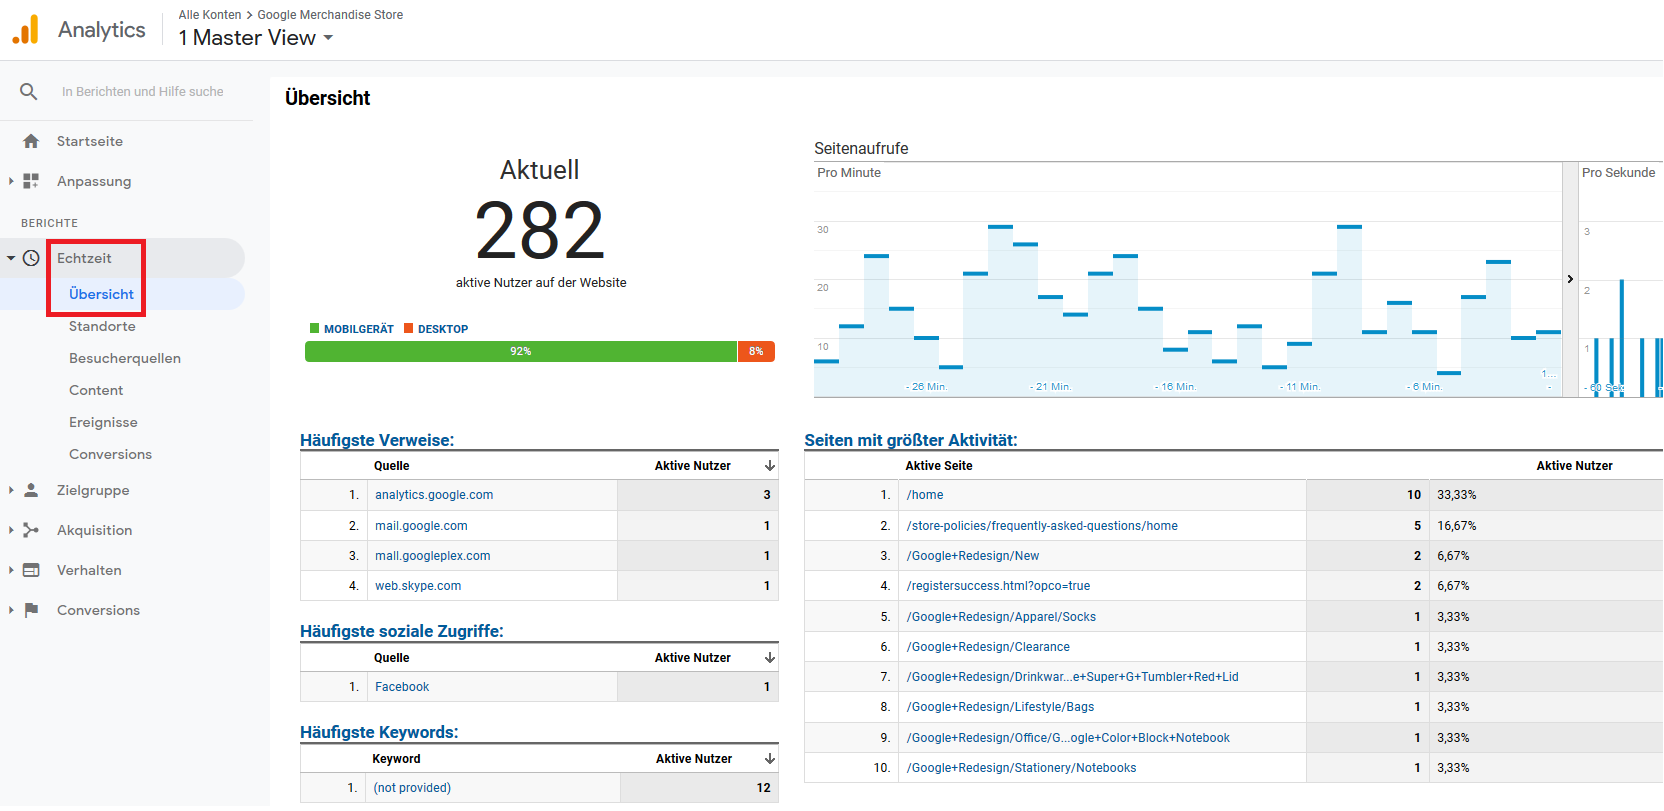
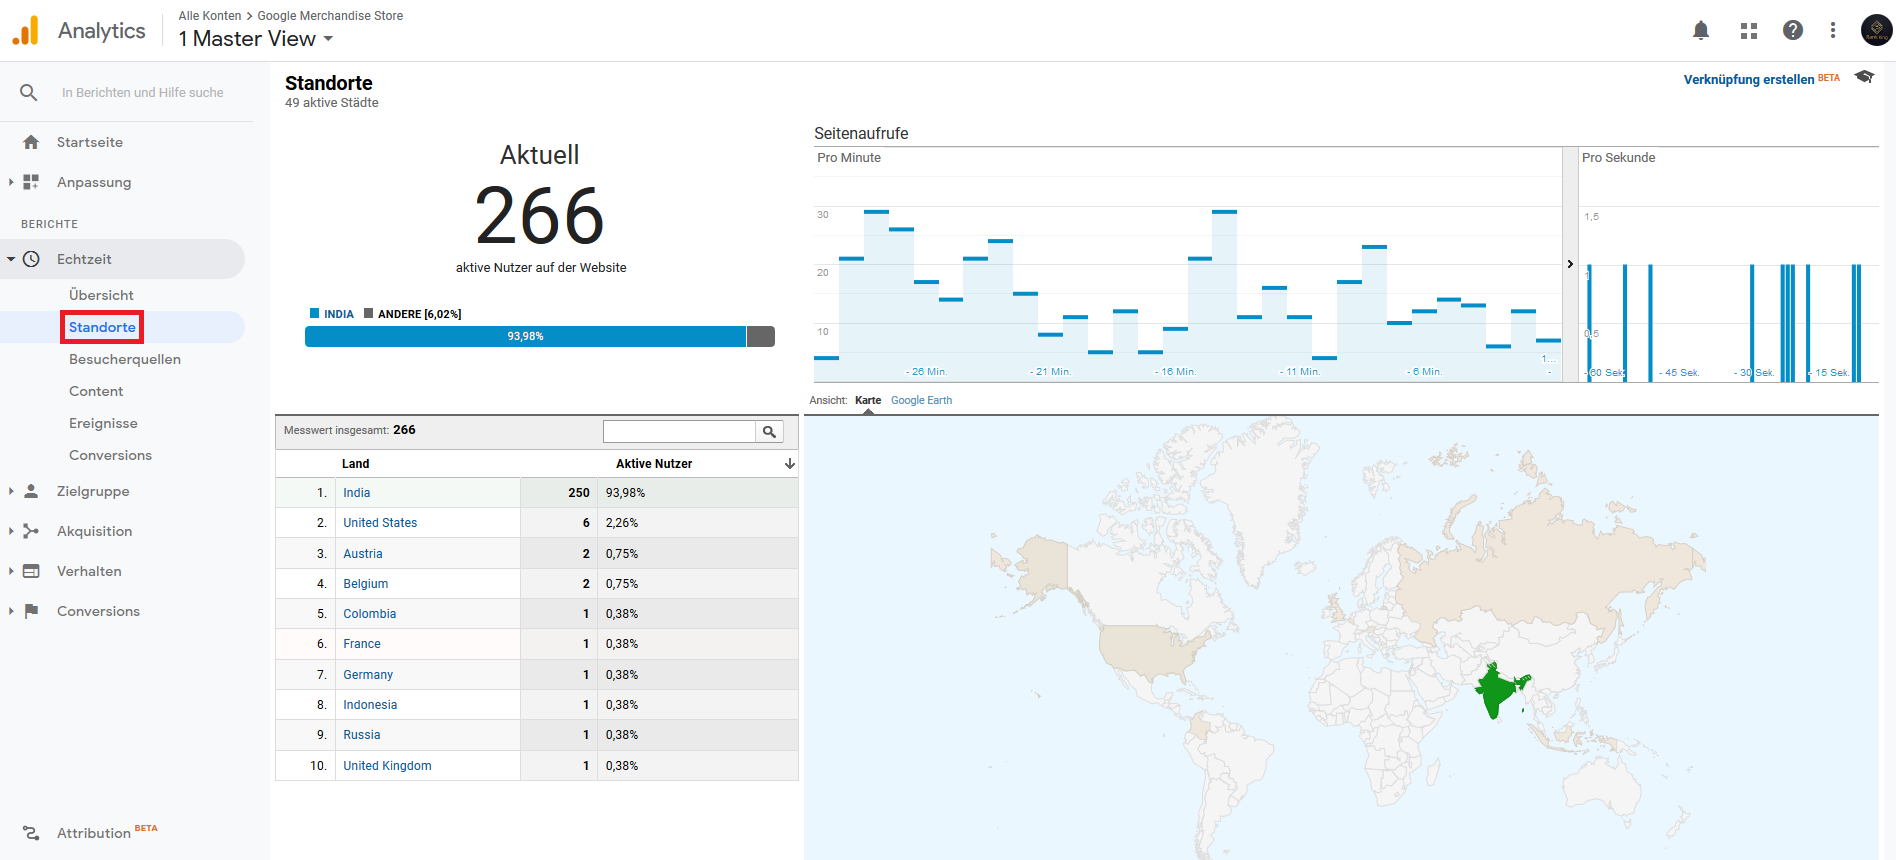
The real-time reports are updated when Analytics gets new hits. The dashboard shows how the users are consuming content and gives insights into them. For example, click on the “Locations” option and you will see where the current website users are.
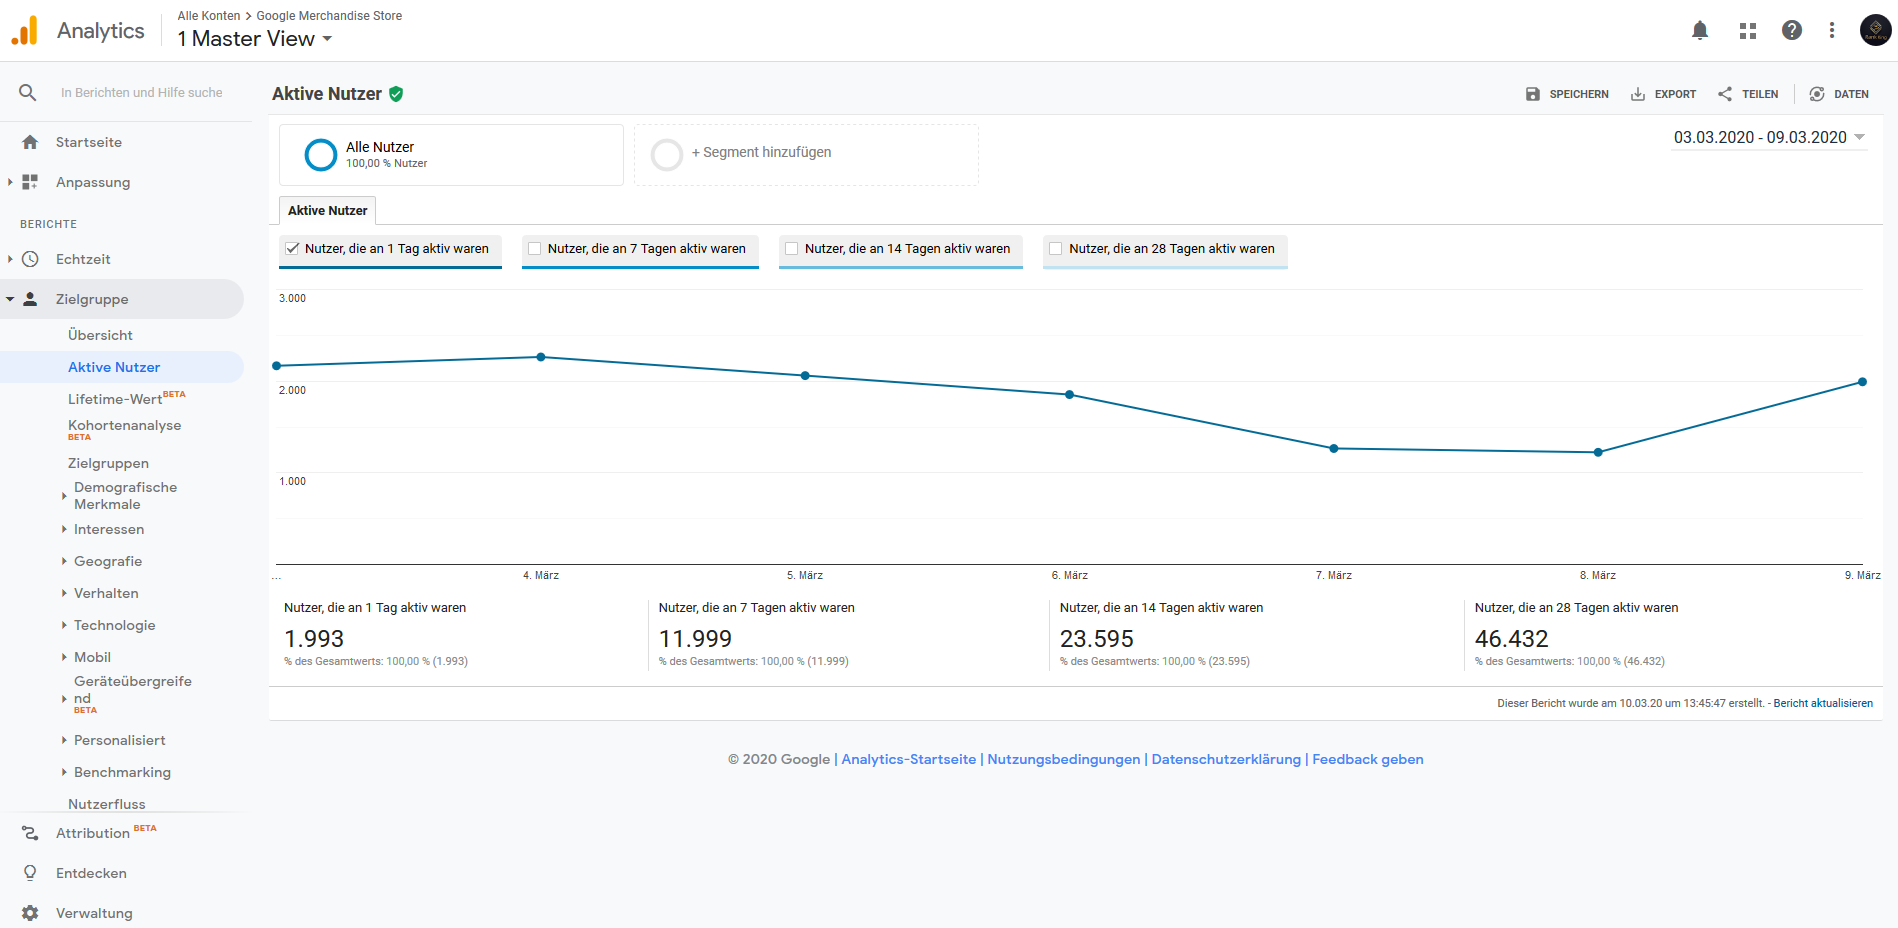
Audience dashboard
The Audience Dashboard is where you can find out more about your website’s users. Not just those who are on the site now, but everyone. Open the overview part of the dashboard and you will get a comprehensive overview of the data made available to you by Analytics.
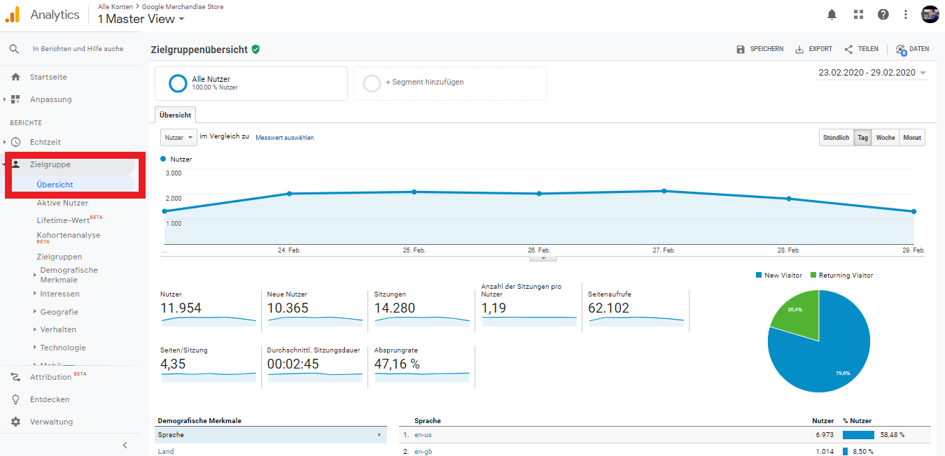
For the period of time you choose, you can see how many users and sessions your website has had. You can also view things like how long users have been on your site and the number of pages they typically visit.
If you select one of the other reports in the target group dashboard, you can get even deeper insight into the user data.
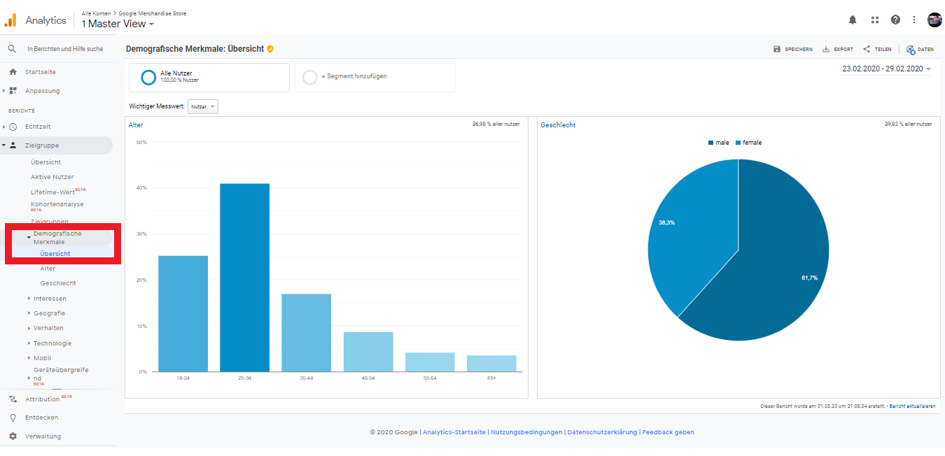
For example, you can go to the Demographics section, as shown above. This report shows you how your website audience is broken down by age and gender. This can be important information for a marketing campaign.
Acquisition dashboard
The audience dashboard informs you about the users of your website. The Acquisition dashboard gives you an insight into how these users found your website. This part of Analytics begins again with an overview report.
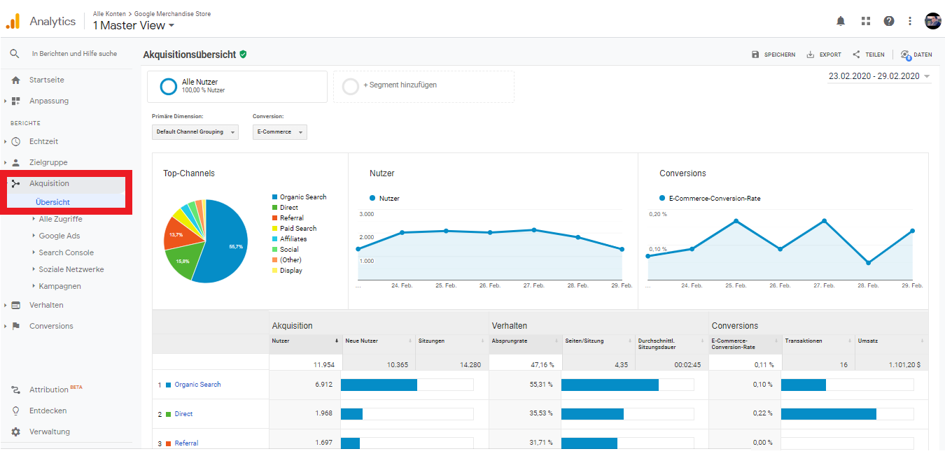
This report shows several dimensions and metrics. The metrics and dimensions are divided into three categories: “Acquisition”, “Behavior” and “Conversions”.
The acquisition information gives you information about the users that your site receives from different channels. Behavioral metrics tell what these users are doing while the data in Conversions shows how users convert from different channels.
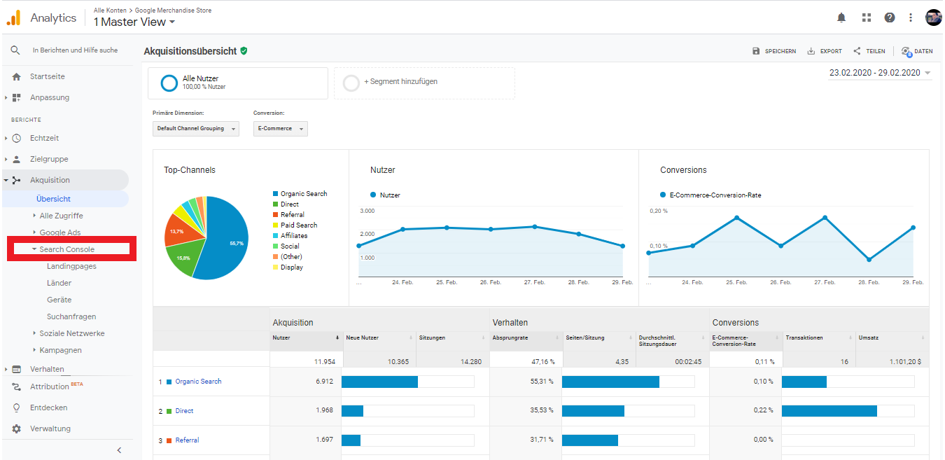
The other reports on the Acquisitions dashboard allow you to analyze your data in a number of ways. Under “All hits” you will find more detailed reports on the data shown in the overview report.
Other options, however, look specifically at individual acquisition channels. In the “Search Console” reports, for example, you can see how users get to your site via internal search. For example, you can find out how many people are accessing your website through Google and what search terms they are using.
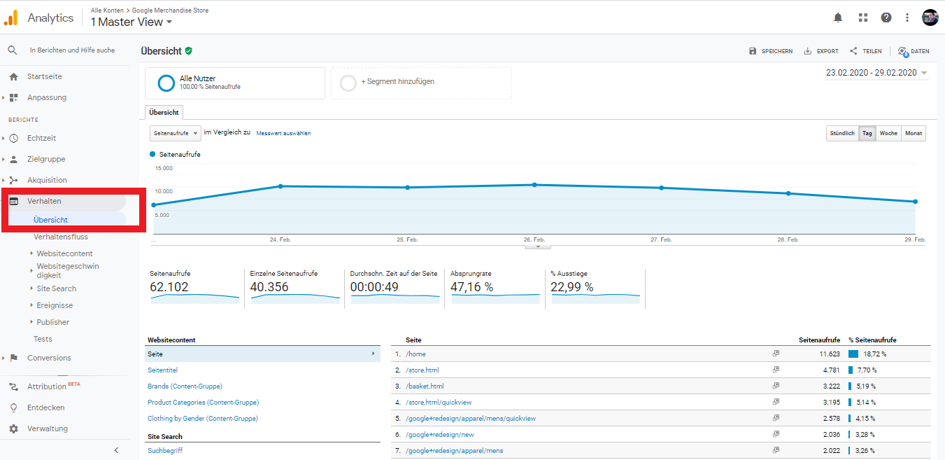
Behavior dashboard
Some of the reports mentioned earlier include data on how users interact with your website. You can get more data on this from the behavior dashboard. The overview report shows you information about page views, session duration and bounce rate as well as further details on user behavior.
The behavior reports are particularly useful for assessing the performance of the various pages on your website. The “website content” report is ideal for this.
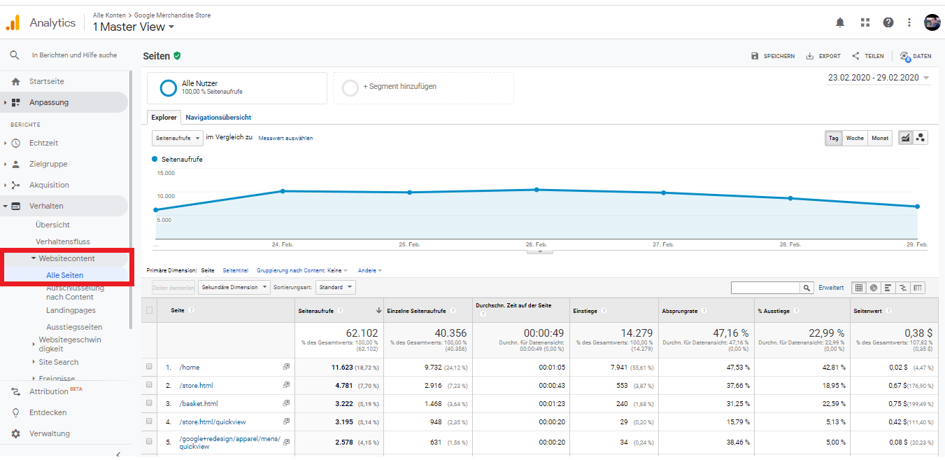
This report shows a wide range of metrics related to the different pages of your website. This includes things like pageviews, average time on the page, and the bounce rate.
These metrics can be really useful. They tell you how popular your sites are.
You can see which pages are getting the most hits and which are holding users’ attention the longest. These insights tell you what type of content to focus on in the future. They also show whether you should improve or even delete some existing pages.
Conversions dashboard
The last of the most important analytics dashboards is the conversions dashboard. This part of the platform shows how visitors “convert” using your website. That means how often they take the desired actions on your website. As such, this dashboard is linked to the goals that you set up earlier.
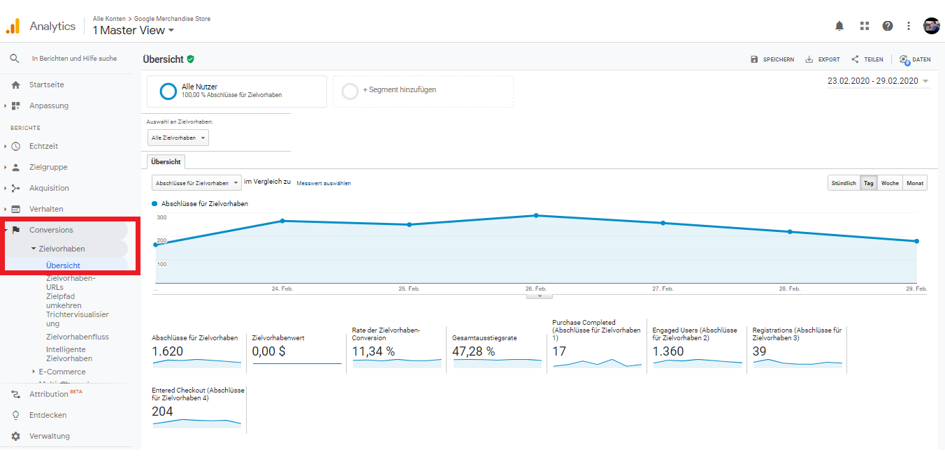
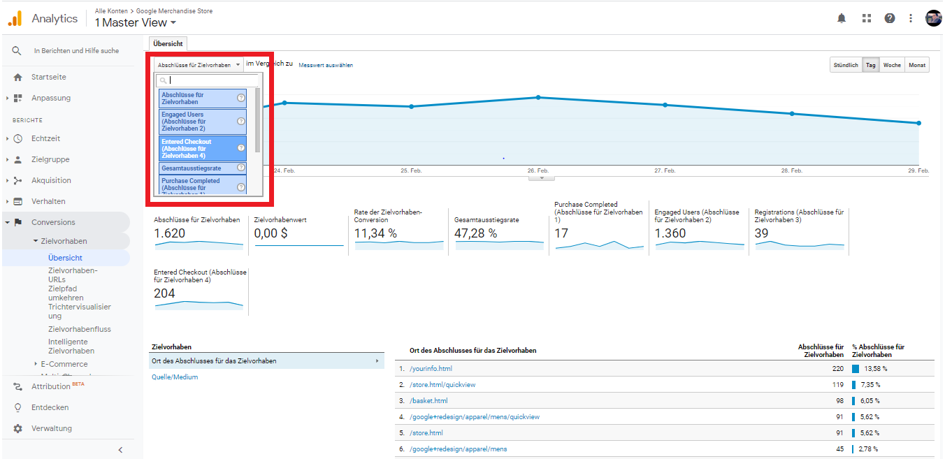
“Goals” is the main part of this dashboard. Here you can find reports in conversions for the various goals that you may have configured. By default, the overview report shows you the total number of conversions for your website and their distribution across the various goals.
You can also edit the summary report to focus on one of your goals using the drop-down menu shown below:
Practical tip: Get more out of SEO with Analytics and SEMrush
If you want to go one step further, you should familiarize yourself with SEMrush afterwards . The SEO software is first and foremost our favorite because it provides the largest amount of data worldwide for analysis in all aspects of SEO. This includes, in particular, data on keyword research, backlinks and traffic analysis. On top of that, we’re not friends of a lot of tools that you pay for and that you don’t end up using much.
SEMrush has managed to develop a comprehensive software for SEO that really covers everything you need, so that even the free version will help most people.
What makes the software for beginners but so much more valuable, the possibility is also all the tools SEMrush with Google Analytics to combine . This feeds the software with detailed data from Analytics and can then reveal precise suggestions for improvement and possible errors on your website.
For example, you can get a free scan every month with the Site Audit Tool . The subsequent report will then show you technical and more general on-page factors that you can improve based on your website and how you are doing it exactly.
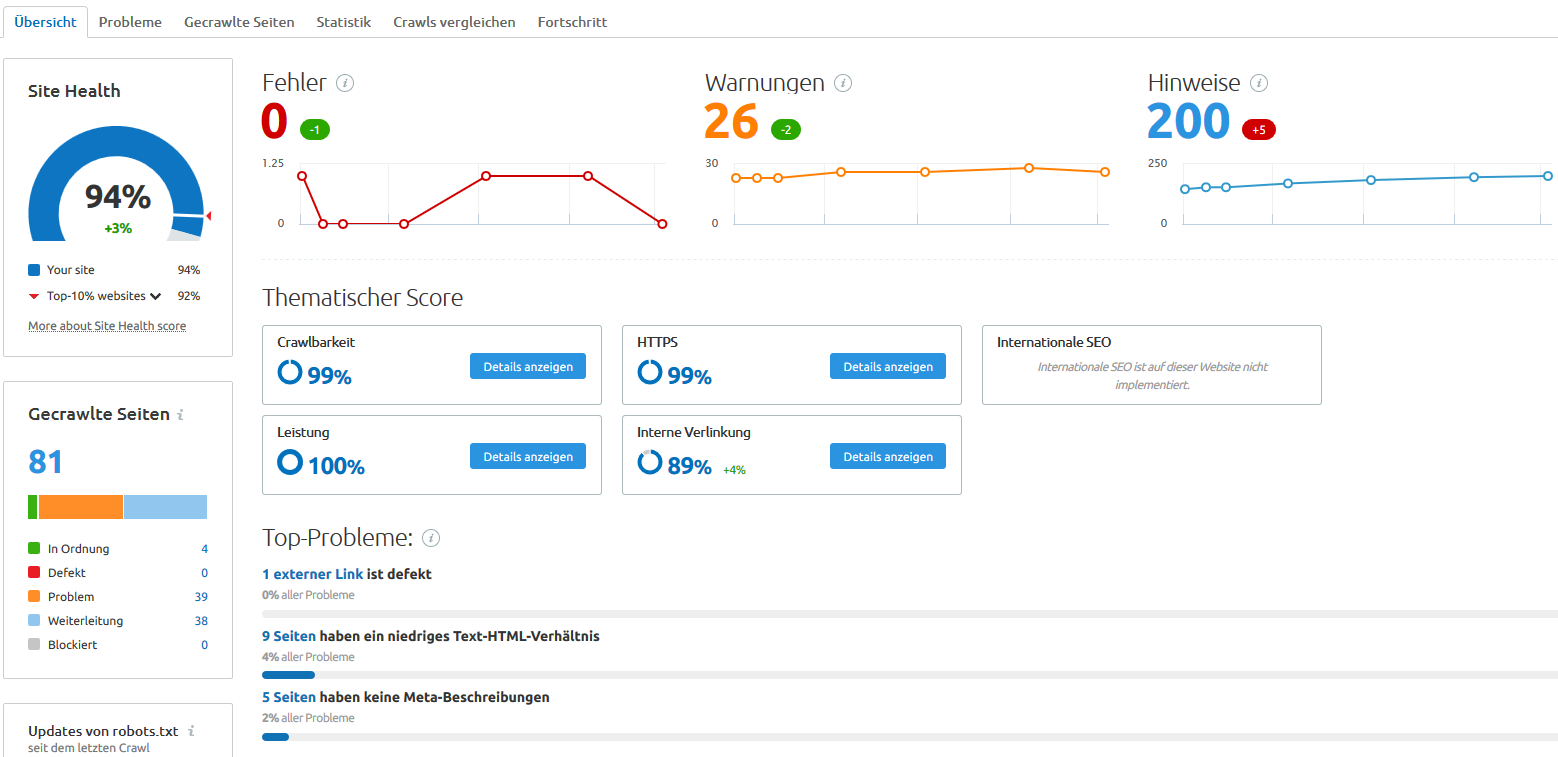
With a click on the errors, warnings or notes, you will be shown a list with all suggestions for improvement.
If you want to scan your website right away, you can do that right here .
Closing word
Now you can start collecting your website data with Google Analytics. You know what the platform is all about and how to set it up. You should also have a good idea of the different ways you can use the platform to support your website. From optimizing marketing campaigns to improving website content, analytics can help you in many different areas.